APPLICATION OF PROBABILITIES TO LOCAL CORONA VIRUS TESTING
Using our improvement toolkit to help gain insight into society's critical problems.
The nation is focusing on controlling the spread of the Coronavirus. We measure progress by tracking the results from patient testing. There is an intense interest in the number of confirmed cases, so let’s use an actual example to predict positive cases.
The Florida Department of Health has created an online dashboard to report the results of coronavirus testing. As of Wednesday morning, March 18, 2020, there are 216 positive cases out of 1,233 completed test results.
This data reveals that 17.5% of the tests were positive.
We cannot infer that 17.5% of the entire state population has the virus. We can only say that the sample group which had suspicious symptoms were positive.
The county in Florida where I live, does not have any confirmed cases. The lack of positives is likely due to the absence of testing. Starting Monday, a local clinic in the immediate area opened a drive-through test site. On the first day, there 15 people tested.
Question: Of the first 15 tests, what is the probability that we will see no positive tests?
The inverse query is, what is the likelihood that we will see one or more positives? That would mean our county is now on-the-map.
We have to make several assumptions:
1) There are actual undetected cases of the virus in the area; specifically, the distribution of the virus is the same as the state.
2) The screening of individuals to be tested was similar to the state level population.
3) The test kits and test methods were also identical.
Using the online Binomial Probability Calculator by Stattrek.com, I entered 0.175 as the probability of a positive test, 15 local samples for the number of trials, and 0 because I want to know the likelihood that no one in this group will test positive.
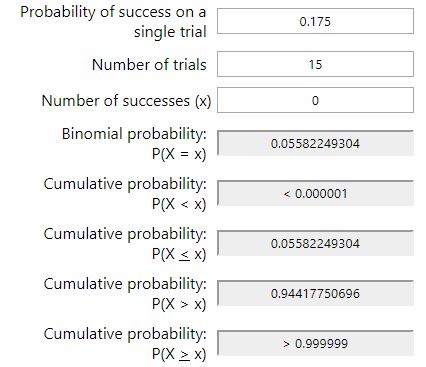
As I feared, the probability of having no positive cases P(X = 0) is low, only about 6%.
THE CUMULATIVE PROBABILITY OF 1 OR MORE P(X>0) FROM THIS GROUP TESTING POSITIVE FOR THE VIRUS IS 94%.
If we multiply 15 tests by the state-wide average of 17.5%, the result is 2.6 positives, but it is useful to know the range of possible positive outcomes. Using the binomial confidence interval calculation (this table is from SigmaZone SPC-XL). We find that the 99% confidence interval is 15% to 20%.
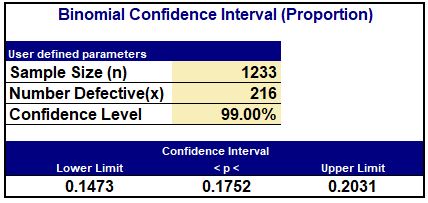
WITH A SAMPLE SIZE OF 15 THEN WE SHOULD EXPECT BETWEEN 2 AND 3 POSITIVES.
Unless the occurrence of the virus in my local area is lower than the state-wide average, my prediction is that my county will have a confirmed case(s) when the results from the first test group are known. Since individual medical results are confidential, I will not be able to confirm the prediction, but the county results will provide a proxy.