THE RESULTS ARE IN – DID THE NUMBER OF POSITIVES IN LOCAL CORONA VIRUS TESTING CONFIRM THE PREDICTION?
Using our improvement toolkit to help gain insight into society's critical problems.
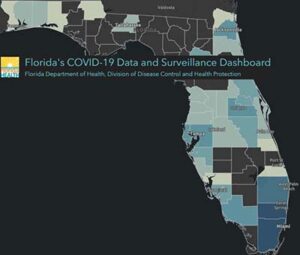
The results from the first COVID-19 sample group in my county are now on the Florida Department of Health website. In my first paper, I used the binomial distribution to predict with 94% confidence that one or more of the first 15 people in my county to be tested would return positive. Link to earlier paper.
So how well did I do?
The Florida Department of Health just reported that of the 17 people who received tests, 1 case returned positive for COVID-19.
The Prediction Confirmed
That is not the end of the story. The 99% confidence interval indicated that the true but unknown percentage of people who are being screened and then tested positive would be in the range of 15% to 20%. That suggested 2 or 3 cases out of 15 would be positive.
SINCE WE ONLY OBSERVED 1 POSITIVE (6% OF THE SAMPLE), DOES THAT PROVE THAT THE LOCAL SAMPLE GROUP IS SOMEHOW DIFFERENT THAN THE STATEWIDE POPULATION?
We left in suspense until the local sample group large enough to run a test of proportions. As a minimum, the n *p (sample size times the percent positives) should be greater than 5. If the proportion of positives in our local county population remains at 6%, we will have to wait until 85 people are tested. If the proportion of positives increases toward the statewide level, then we only need about 29 samples to perform the test.


