APPLICATION OF HYPOTHESIS TESTS TO CORONA VIRUS TESTING
Using our improvement toolkit to help gain insight into society's critical problems.
This article is part 3 of using our improvement toolkit to gain some small insights into COVID-19 testing.
The world is focusing on controlling the spread of the Coronavirus. We measure progress by tracking the results from patient testing. There is an intense interest in the number of confirmed cases. In my first article, I used the binomial distribution to predict with 94% confidence that one or more of the first 15 people in my local county to be tested would return positive. Here is a link to earlier paper.
In a follow-up, I reported that the local results of the first group to be tested (1 positive of 17 tests) and stated that the data confirmed. The binomial corrected predicted a high probability of having at least one positive, but we did not see the 2 to 3 cases that the confidence interval suggested. I asked the question, is the local test sample different from the larger statewide population? That is important because if there is a significant difference, then the binomial does not apply. Here is a link to part 2.
To perform the hypothesis test, we need the sample size (n) times its percentage positives (p) expressed as a decimal to be greater than 5. As of Wednesday morning March 25, 2020, the Florida Department of Health website shows 10 positives out of 86 tests, so n*p >10.
The sample size for local county testing is now large enough to perform a hypothesis test for attribute data, specifically the test of proportions.
Have the rates of positive tests been changing over the last week? Our local results have increased from 6% to almost 12%. The statewide results have decreased from 17.5% to just under 10%. Currently, they happen to be converging.
I entered current numbers for both the local and statewide groups into the Two Proportions Test in Sigmazone’s QuantumXL:
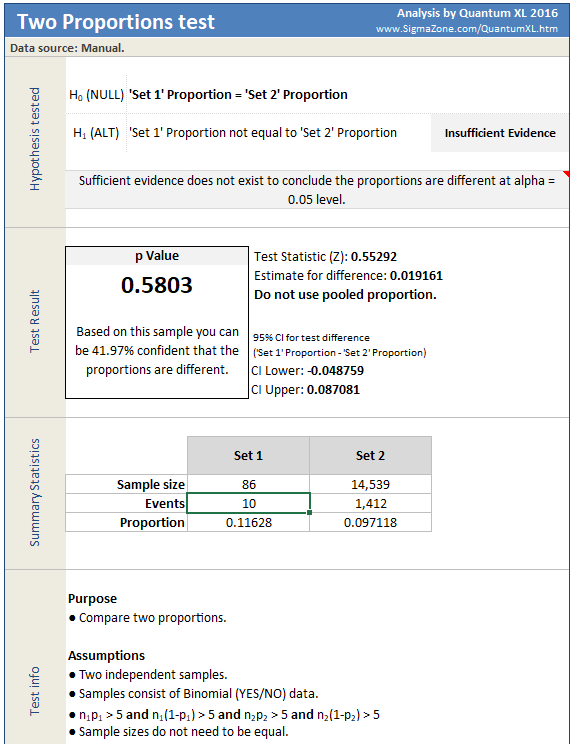
Since we cannot prove the H0 (Null) hypothesis (that the two groups are equal), we look to the H1 hypothesis to see if there is a statistical difference between them. The result is a p-value of 0.58, about the same chance of heads or tails when tossing a coin; therefore, we cannot say that the two groups are different.
It is safe to assume that the local and statewide groups are currently similar.
I also compared the current local results to the statewide results from last week. There was also insufficient evidence to suggest a difference (P-value of 0.1).
Using the latest values for the statewide testing, I used SigmaZone SPC-XL to calculate the new 99% confidence interval.
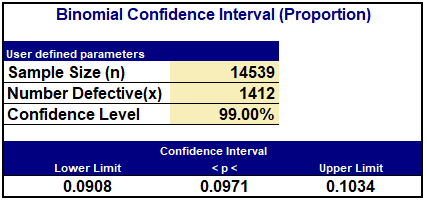
From this result, we can make the statement that the true but unknown percentage of people that pass the screening criteria and then test positive is somewhere between 9% and 10%. Note that the size of the statewide sample has grown by a factor of 10X since last week, producing a narrower interval.
Discussion
The binomial distribution is valid when independent sampling events with equal probability. Does it apply in this situation when we know that the number of people infected is changing daily? When making any calculations, you have to make assumptions. Mine are:
1) The screening of individuals for testing normalized any differences between the local and statewide infection rates.
2) At the time of calculation, the sample group has the same probability of finding positives as the historical prediction.
Note: As the percentage of positives changes, recalculate both the binomial distribution the confidence interval.
These simple statistics do not replace complex simulations, but they can give us insights into specific questions. The British statistician named George Box wrote, “All models are wrong; some are useful.” His point we should try to perform useful calculations rather than doing nothing because we are debating on all of the ways that it does not apply.
I would like to acknowledge and thank Dr. Ronald L. Berdine for reviewing and commenting on this work.
Are you deploying data analysis as part of your improvement program? Partner with someone who has a Proven History, uses a Blended Approach and has generated Superior Results. Contact me when you are ready to energize your improvement program.